Bitcoin At A Critical Juncture: Key Price Levels To Watch
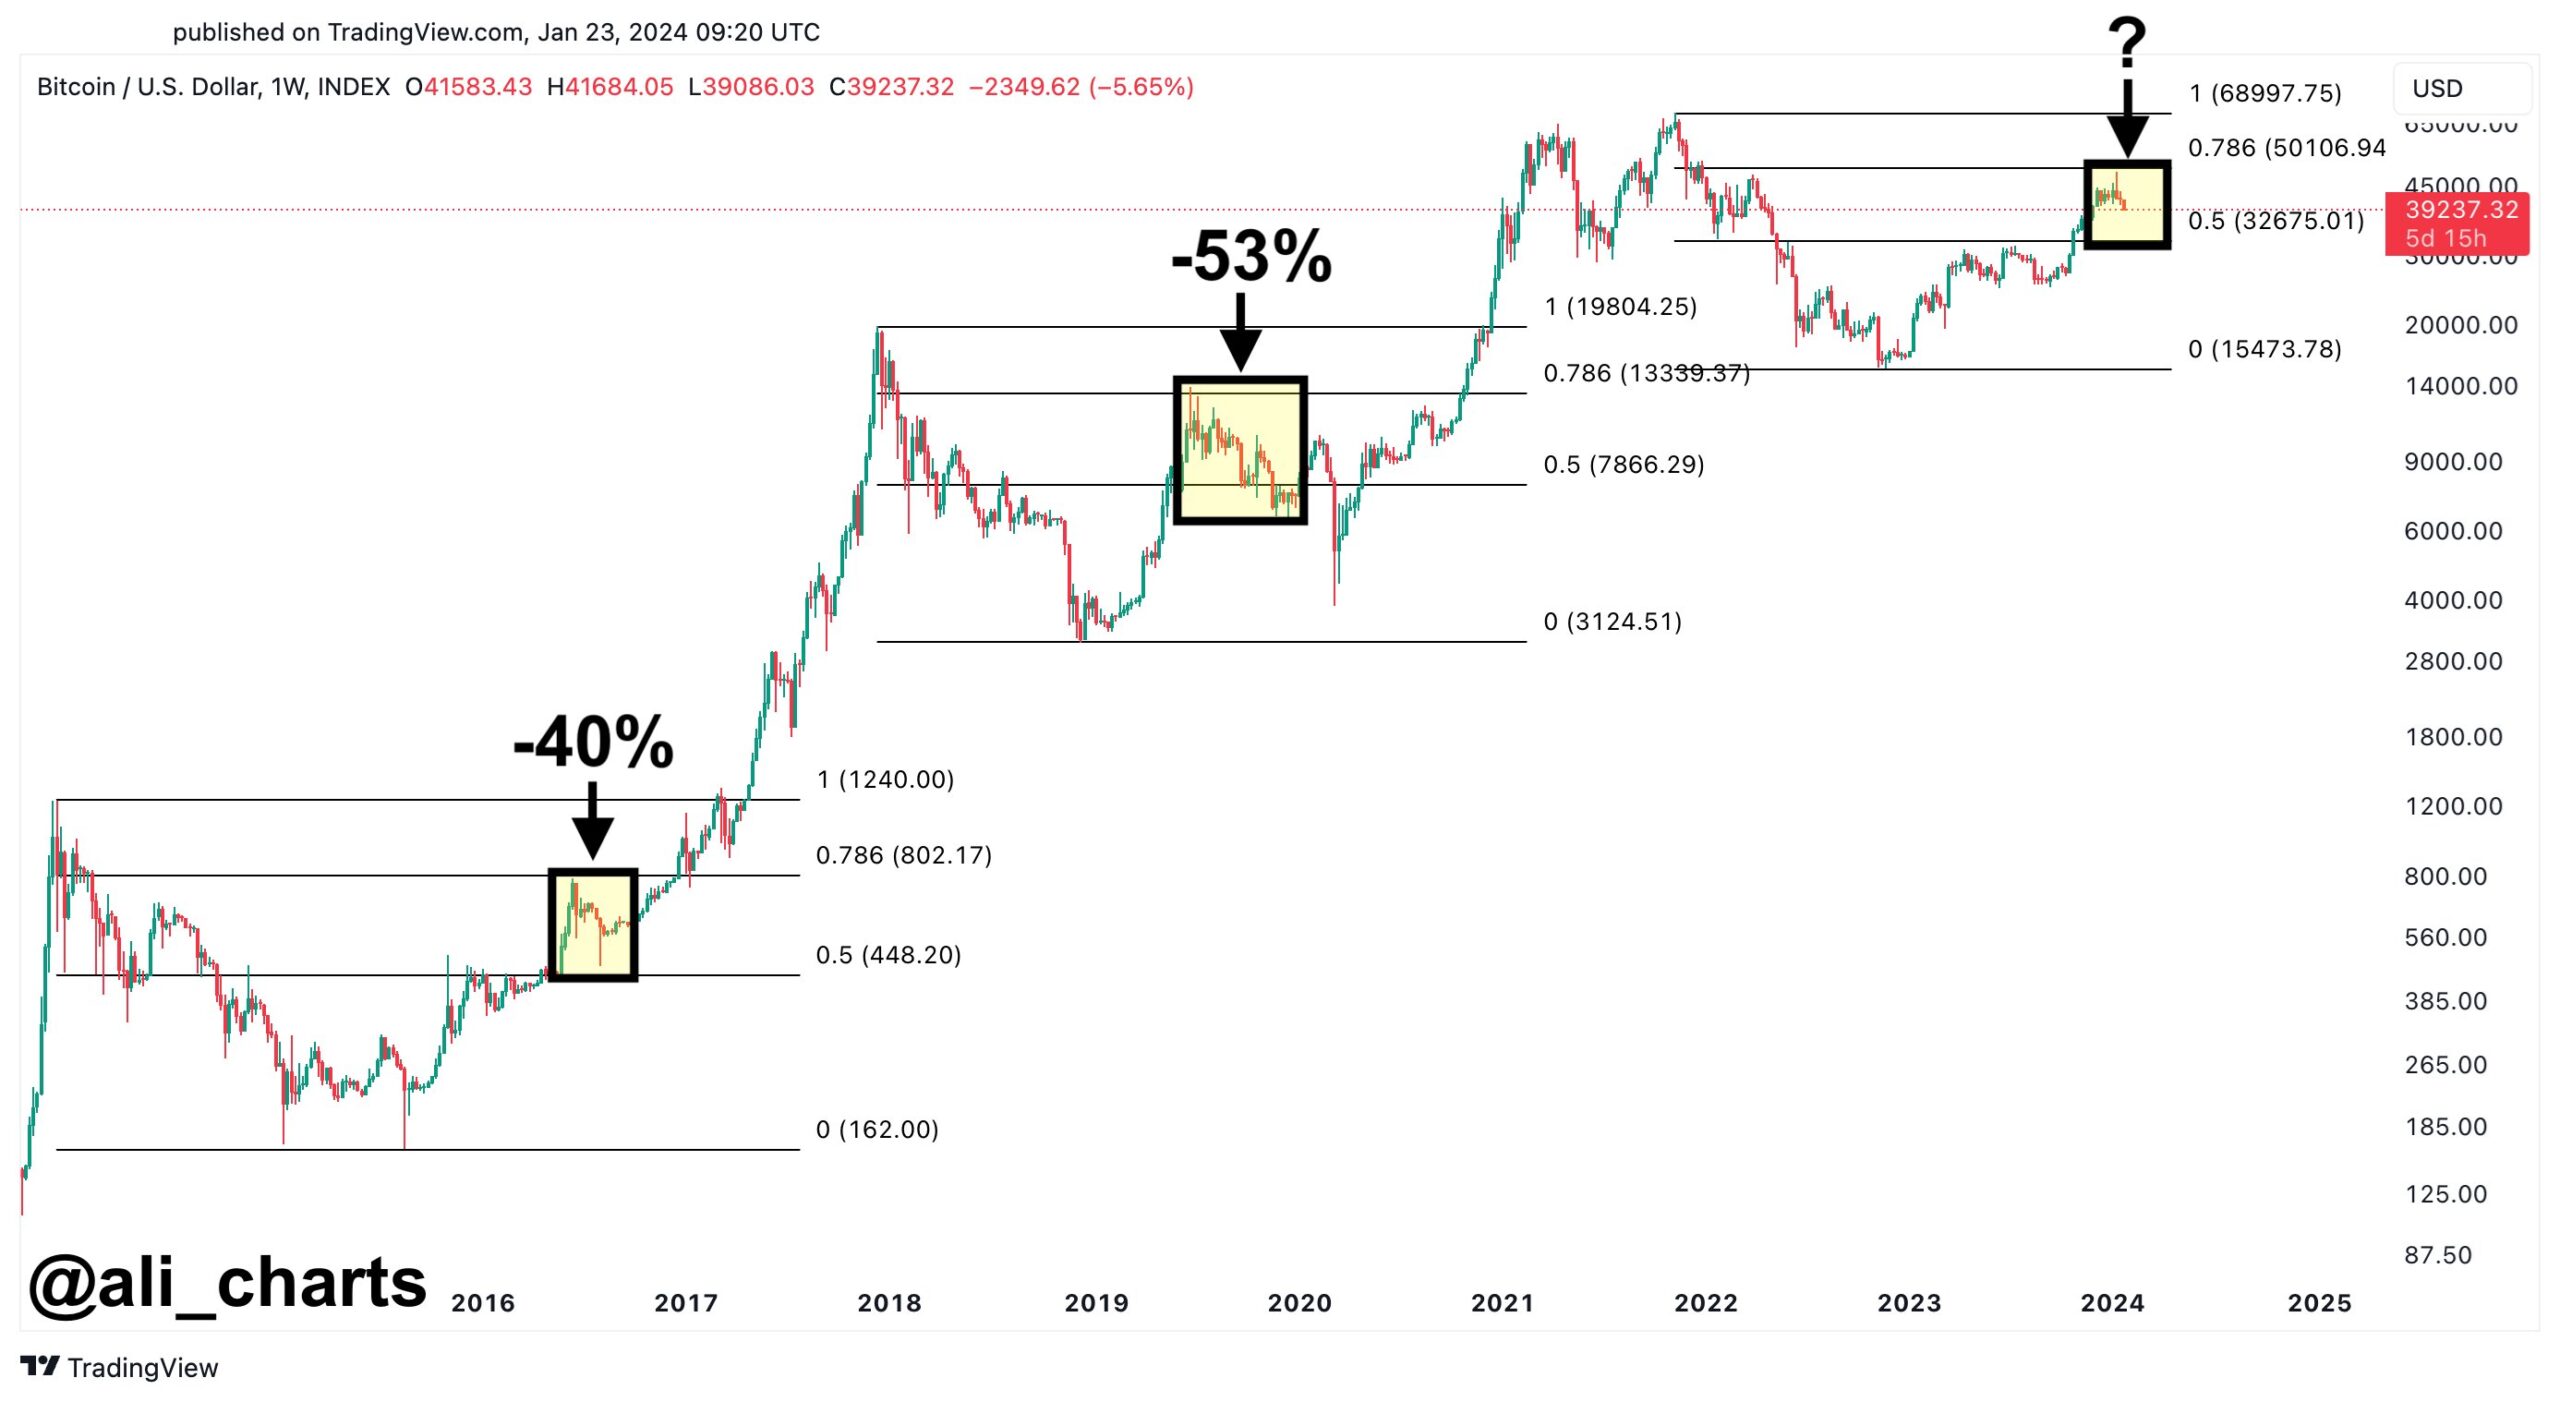
Table of Contents
Identifying Key Support Levels for Bitcoin
Support levels represent price points where buying pressure is expected to outweigh selling pressure, preventing further price declines. Understanding these key Bitcoin price levels is vital for risk management.
The $25,000 Support Level
This level represents a significant psychological barrier and a key area where buyers have historically stepped in. A break below this could signal further downside.
- Factors influencing the $25,000 support: Macroeconomic conditions (inflation, interest rates), regulatory news (new laws impacting crypto), and overall market sentiment (fear, uncertainty, and doubt or FUD).
- Potential consequences of a break below $25,000: Triggering further sell-offs, potentially leading to lower support levels like $20,000 or even lower, depending on the severity of the market downturn. This could signal a significant bearish trend.
The $20,000 Support Level
A break below $25,000 could lead to a test of the $20,000 level, a crucial historical support zone. The strength of this support will depend on prevailing market conditions and investor confidence.
- Historical significance of the $20,000 level: It acted as a significant support and resistance level in the past, marking a period of consolidation and accumulation before previous price surges.
- Technical indicators to watch for confirmation: Moving averages (20-day, 50-day, 200-day), Relative Strength Index (RSI), and Moving Average Convergence Divergence (MACD) can provide confirmation of support or a potential breakdown.
Identifying Strong Support via On-Chain Analysis
Examining on-chain metrics can provide a deeper understanding of Bitcoin's underlying strength beyond simple price action. This allows for identifying robust support zones that might not be immediately apparent from price charts alone.
- Metrics to Consider: Realized cap (the average cost basis of all Bitcoins), Net Unrealized Profit/Loss (NuPL), and miner behavior (selling pressure from miners).
- How these metrics enhance our understanding: They provide insights into the cost basis of Bitcoin holders, overall market sentiment among long-term holders, and the potential for sustained selling pressure from miners. This allows for a more nuanced view of support levels.
Analyzing Crucial Resistance Levels for Bitcoin
Resistance levels represent price points where selling pressure is expected to outweigh buying pressure, hindering further price increases. These Bitcoin price levels are critical for identifying potential profit-taking opportunities.
The $30,000 Resistance Level
This level represents a significant hurdle for Bitcoin to overcome. A sustained break above this could signal a bullish trend reversal and the start of a new upward cycle.
- Factors influencing the $30,000 resistance: Positive market sentiment (bullish news and adoption), institutional adoption (large-scale investments by institutional investors), and regulatory clarity (clear legal frameworks).
- Potential consequences of a successful break above $30,000: Could trigger a price rally towards higher resistance levels like $40,000 or even higher, depending on the strength of the upward momentum.
The $40,000 Resistance Level
A break above $30,000 would likely lead to a test of $40,000, another significant psychological and technical resistance area. This level has historically marked significant price ceilings in the past.
- Historical significance of the $40,000 level: Served as a major resistance point in previous bull runs, representing a critical psychological barrier for many investors.
- Technical indicators to watch for confirmation: Volume confirmation (high trading volume accompanying a breakout) and breakouts on higher timeframes (weekly or monthly charts) provide stronger confirmation of a trend reversal.
Long-Term Resistance and Market Cycle Analysis
Considering Bitcoin's historical cycles and the halving cycle provides a valuable long-term perspective on potential resistance levels.
- Historical Cycle Analysis: Examining past bull and bear markets reveals patterns and potential resistance areas based on previous price action and market cycles.
- The importance of the Bitcoin Halving Cycle: The halving, which reduces the rate of new Bitcoin creation, has historically coincided with significant price increases due to decreasing supply. This event plays a major role in shaping long-term price trajectories.
Factors Affecting Bitcoin Price Levels
Several external factors beyond pure technical analysis significantly impact Bitcoin's price action and its key support and resistance levels.
Macroeconomic Conditions
Inflation rates, interest rate hikes, and economic recession fears significantly influence Bitcoin's price, often correlating with movements in traditional markets.
- Correlation between Bitcoin and the stock market: Bitcoin, while often touted as "digital gold," displays some correlation with traditional market movements. Bear markets in equities can negatively impact Bitcoin prices, and vice-versa.
- Impact of monetary policy on Bitcoin: Changes in interest rates affect investor behavior. Higher rates can decrease risk appetite, impacting Bitcoin's price, which often benefits from investors seeking inflation hedges.
Regulatory Landscape
Government regulations and legal frameworks governing cryptocurrencies globally impact investor confidence and the overall stability of the market.
- Key regions to watch for regulatory updates: The US, EU, and China are crucial regions to monitor for regulatory developments that could influence Bitcoin's price.
- Impact of positive/negative regulatory changes: Positive developments (clear regulations, institutional acceptance) can drive bullish sentiment, while negative developments (bans, stringent regulations) can cause sharp price drops.
Technological Advancements and Market Sentiment
Network upgrades, adoption rates, and overall market sentiment (fear, greed, excitement) play a crucial role in shaping Bitcoin's price and its reaction to key support and resistance levels.
- The role of technological innovation: Network upgrades (like the Lightning Network) and advancements in scalability can positively influence investor confidence and increase adoption rates.
- Impact of social media and news sentiment: How public perception (driven by social media, news outlets, and influencers) influences Bitcoin price fluctuations is significant and often volatile.
Conclusion
Bitcoin's price currently sits at a critical juncture. Analyzing key support and resistance levels – such as the $25,000, $20,000, $30,000, and $40,000 levels – alongside macroeconomic factors, regulations, and technological advancements is crucial for informed investment decisions. Understanding the significance of these Bitcoin price levels and utilizing on-chain analysis can significantly enhance your ability to navigate the market volatility. Stay informed, keep an eye on these critical levels, and make well-researched investment choices based on your risk tolerance. Continue learning about vital Bitcoin price levels to improve your trading strategy and overall understanding of the cryptocurrency market.

Featured Posts
-
 Xrp Etfs Potential For 800 Million In Week 1 Inflows Upon Approval
May 08, 2025
 -
 Superman Vs Darkseids Legion July 2025 Dc Comic Book Preview
May 08, 2025
 -
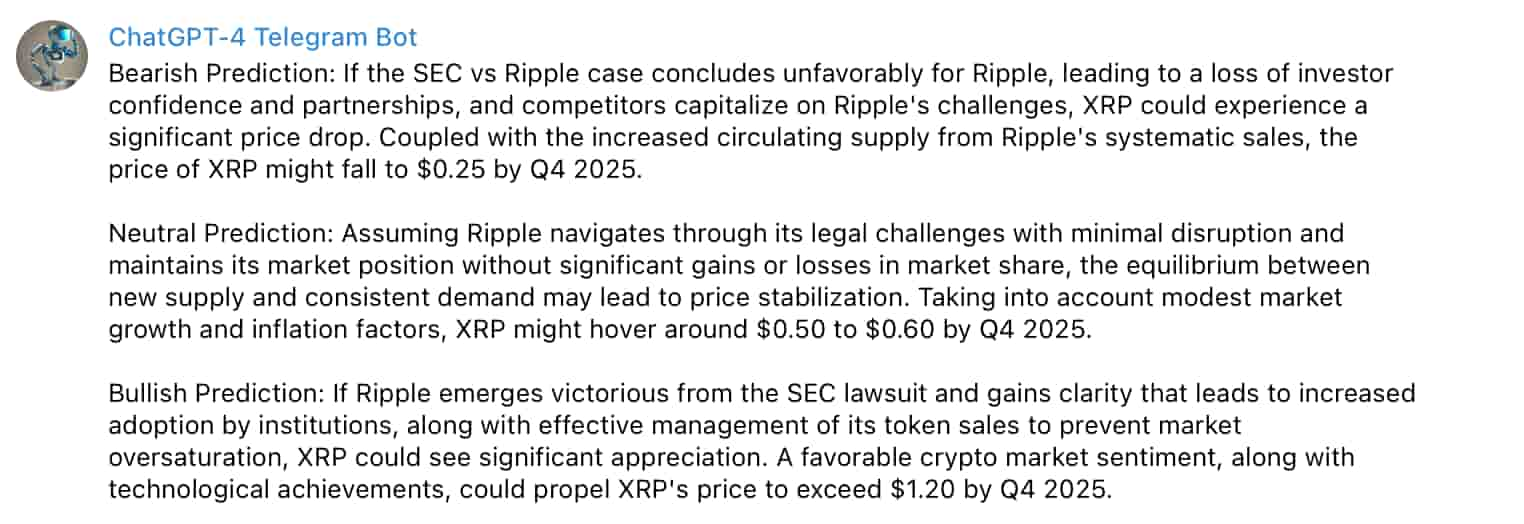 Will Xrp Hit 5 By 2025 Exploring The Possibilities
May 08, 2025
 -
 Latest Lottery Results Lotto Lotto Plus 1 And Lotto Plus 2
May 08, 2025
 -
 Latest News F4 Elden Ring Possum And Superman In The Headlines
May 08, 2025
Latest Posts
-
 Xrp Trading Volume Outpaces Solana Amidst Etf Speculation
May 08, 2025
 -
 Xrp Etf In Brazil Ripple News And Trumps Social Media Activity
May 08, 2025
 -
 Pro Shares Launches Xrp Etfs This Week Impact On Xrp Price
May 08, 2025
 -
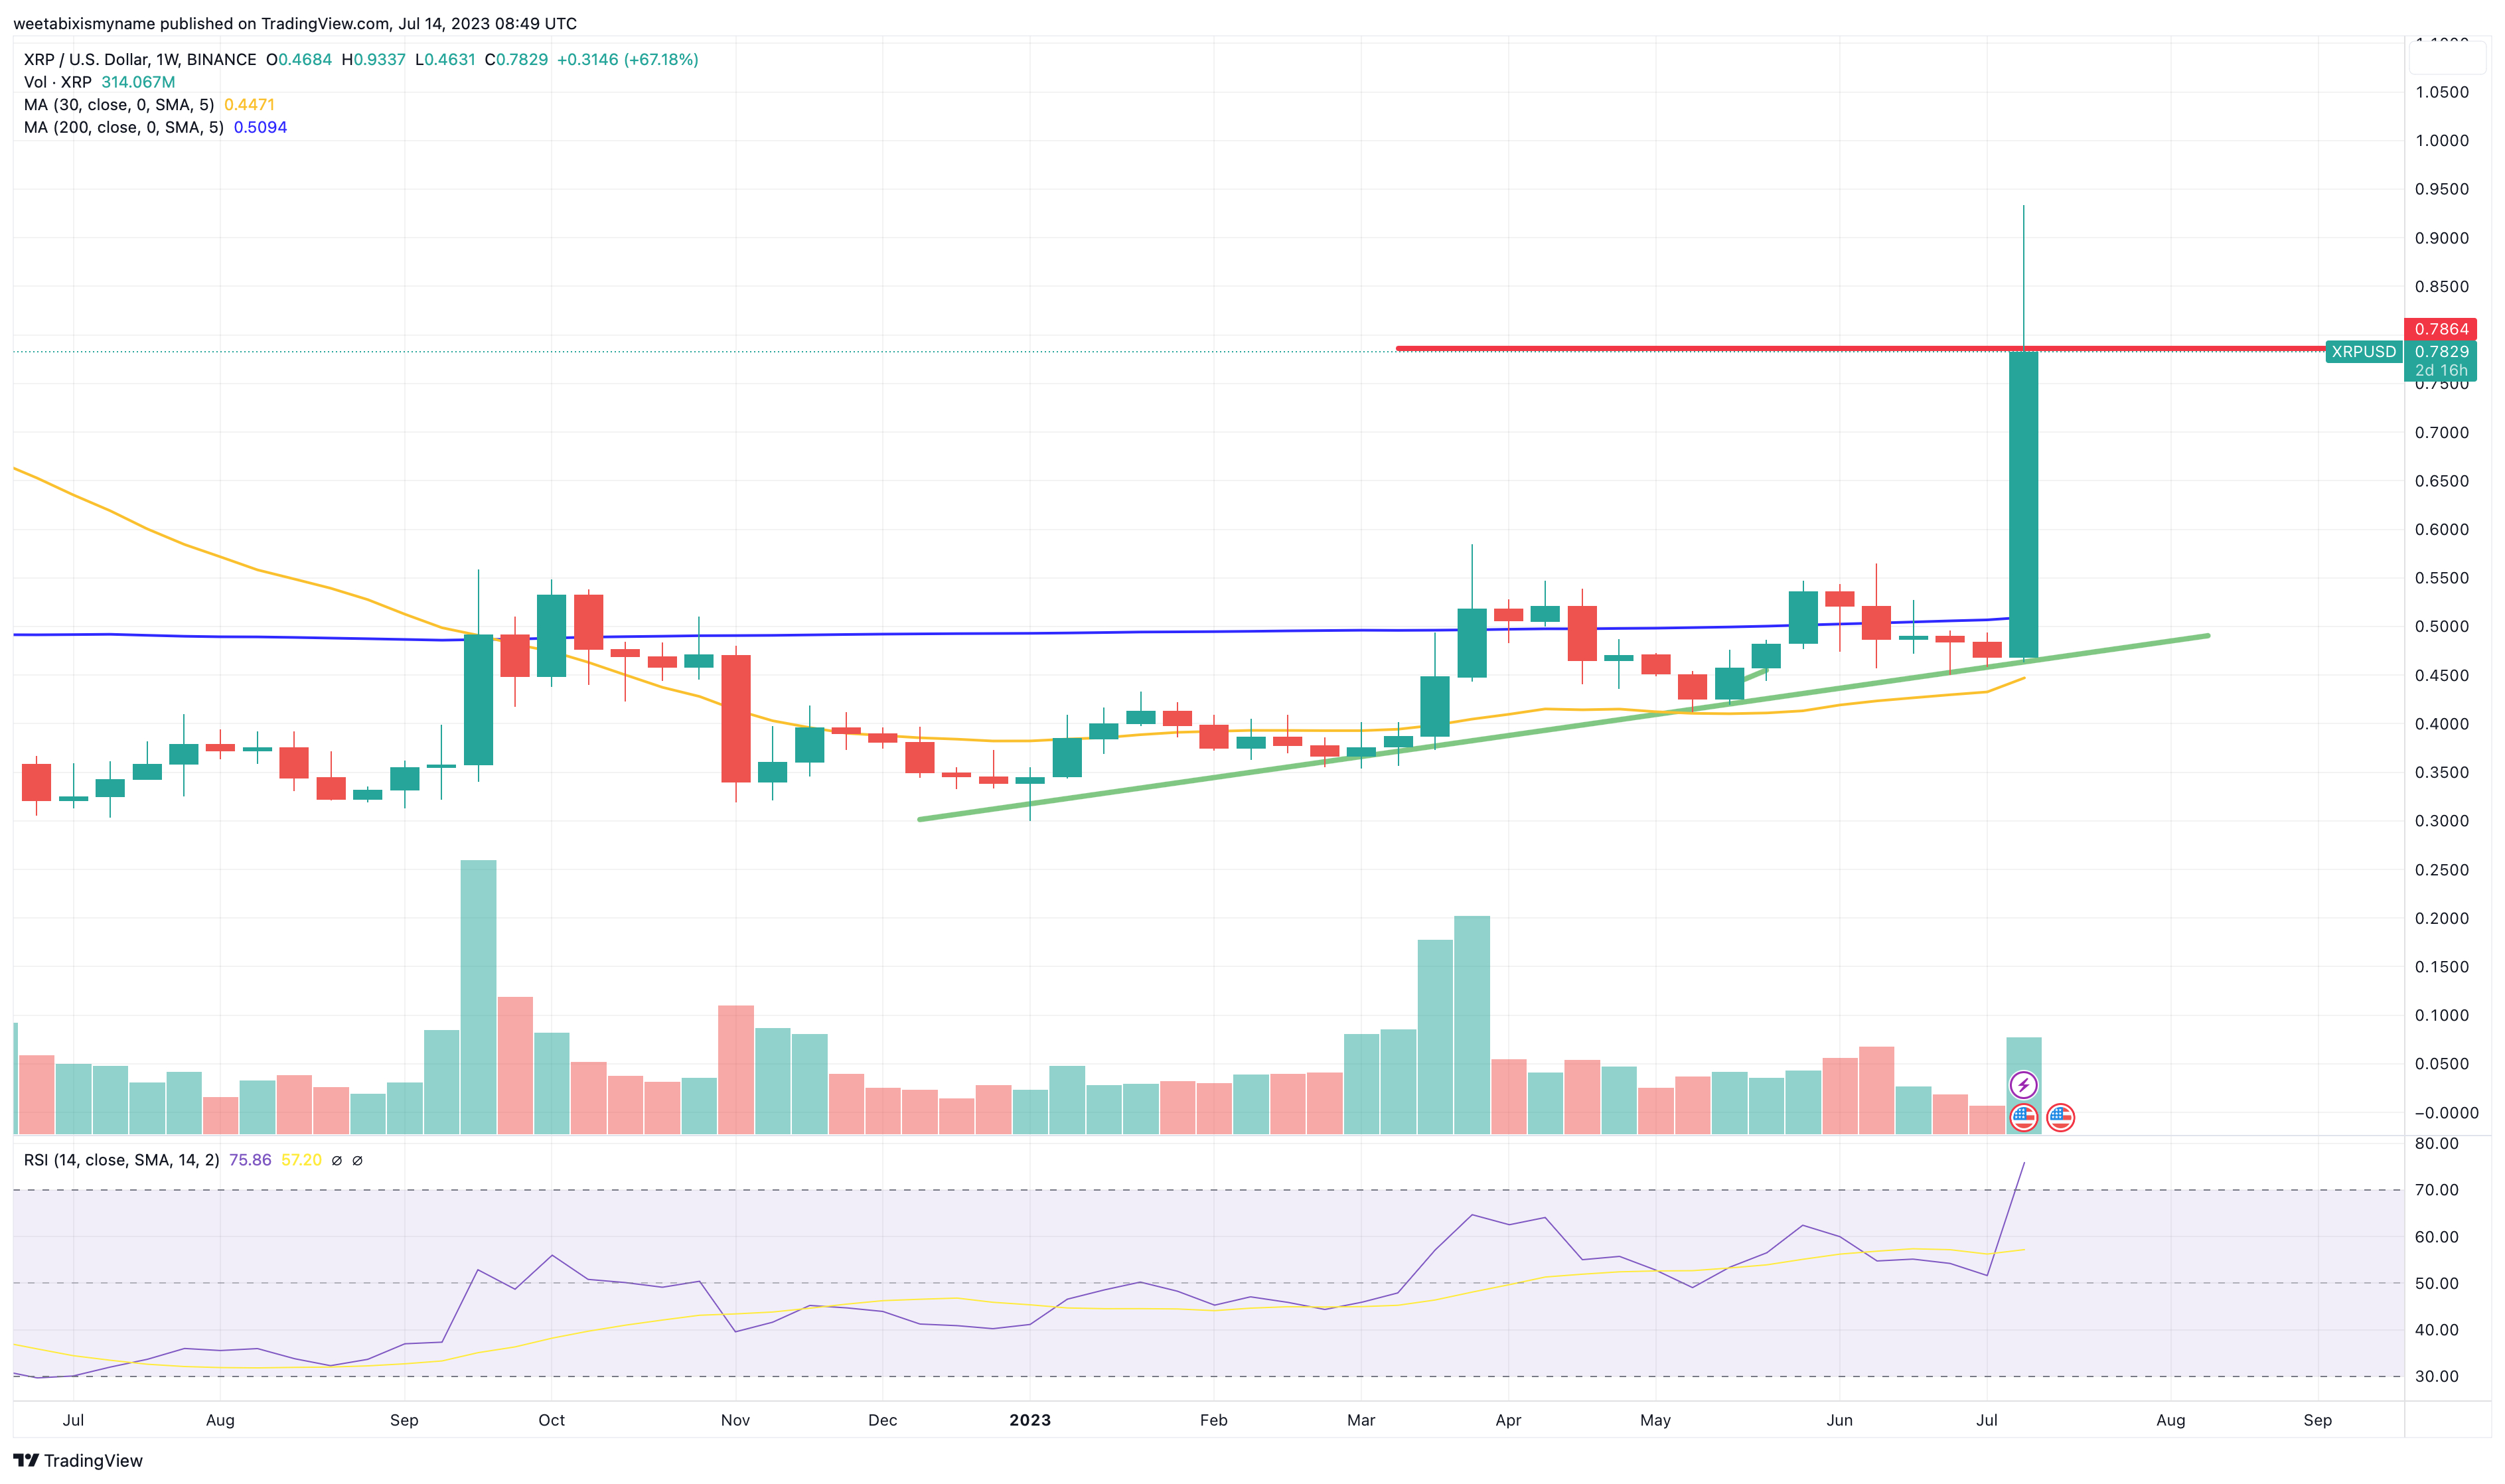 Xrp Price Up 400 Predicting Future Growth Potential
May 08, 2025
 -
 Pro Shares Announces Xrp Etfs No Spot Market But Price Jumps
May 08, 2025
